January 2025 U.S. Building Permits: Mixed Metro Trends in a Tight Market
Updated Fri, May 30, 2025 - 4 min read
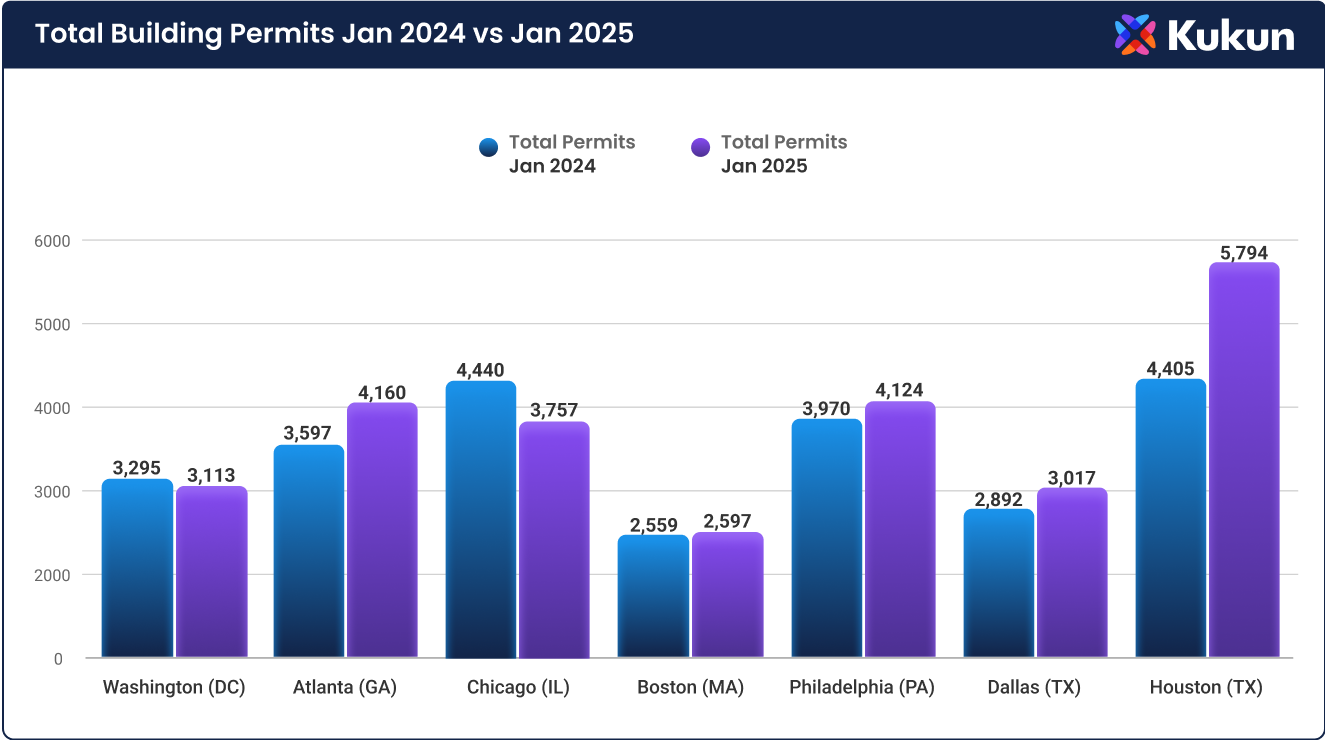
Building permits data for January 2025 show a mixed picture across major U.S. metros. Some markets saw robust growth in permit activity, while others cooled year-over-year. For example, Houston, TX led the gains (total permits +31.5%, single-family +18.5%), followed by Atlanta, GA (total +15.7%, San Francisco +17.0%), Dallas, TX (+4.3% total), and Philadelphia, PA (+3.9%). By contrast, Chicago, IL permits fell sharply (-15.4%), and Washington, DC also dipped (-5.5%). Boston, MA saw a modest rise (+1.5%)【df】. The table below summarizes total and single-family permits in Jan 2024 vs Jan 2025 for each metro:
| City (State) | Total Permits Jan 2024 | Total Permits Jan 2025 | YoY % | SF Permits Jan 2024 | SF Permits Jan 2025 | YoY % |
|---|---|---|---|---|---|---|
| Washington (DC) | 3,295 | 3,113 | -5.5% | 741 | 594 | -19.8% |
| Atlanta (GA) | 3,597 | 4,160 | +15.7% | 2,495 | 2,919 | +17.0% |
| Chicago (IL) | 4,440 | 3,757 | -15.4% | 2,678 | 2,442 | -8.8% |
| Boston (MA) | 2,559 | 2,597 | +1.5% | 1,747 | 1,815 | +3.9% |
| Philadelphia (PA) | 3,970 | 4,124 | +3.9% | 2,978 | 3,034 | +1.9% |
| Dallas (TX) | 2,892 | 3,017 | +4.3% | 2,550 | 2,589 | +1.5% |
| Houston (TX) | 4,405 | 5,794 | +31.5% | 3,535 | 4,190 | +18.5% |
(Note: Single-family (SF) permits are a subset of total permits; data source is Top Metros permit analytics.)
The nationwide picture was relatively flat in January. According to U.S. Census/HUD data, January 2025 building permits ran at a 1.483 million annual rate, virtually unchanged from December but 1.7% below January 2024. Single-family permits held steady at a 996,000 rate (SAAR). In short, national permit issuance has plateaued, reflecting broader market headwinds (higher interest rates, high costs).
For professionals looking to stay ahead of regional construction trends, having timely, detailed permit insights is essential. Our Building Permit Data platform provides granular, metro-level intelligence—updated monthly—to help lenders, suppliers, and investors spot growth markets, track housing cycles, and make data-driven decisions. Whether you’re watching permit volume shifts or planning your next market entry, Kukun’s data equips you with the visibility you need.
Market Context: Rates, Prices, and Costs
Several macro factors are influencing permit activity. Financing costs are high. The Federal Reserve held its target funds rate at 4.25–4.50% in early 2025. Thirty-year mortgage rates remain around 7%—nearly double the level of early 2021. This is slowing demand: U.S. home price growth has decelerated (around +4% year-over-year by early 2025), as rising inventory meets reduced buyer affordability.
Meanwhile, construction costs are a record share of new home prices. NAHB reports construction costs climbed to 64.4% of the final house price in 2024 (up from 60.8% in 2022). Builders cite broad inflation in materials and labor. Tariff-related uncertainty is also a headwind: recent trade policy actions (10% tariffs on Chinese imports, hikes to steel/aluminum tariffs) are expected to “push up building costs”. NAHB/Wells Fargo housing surveys in early 2025 noted rising lumber prices and blamed a slide in builder confidence on tariff concerns.
Let's connect, and see how we can help you stay ahead of the market.
Contact us
In summary, homebuilders are facing competing pressures: high borrowing costs and worsening affordability are limiting demand, even as housing shortages remain. One NAHB executive noted that builders are “cautious” given “elevated mortgage rates, high construction costs and affordability conditions”. Our permit data suggests many builders are focusing on existing project backlogs rather than ramping up new starts.
Key Takeaways for Industry
- Regional divergence: Fast-growing markets (Houston, Atlanta) are showing strong permit demand, whereas markets like Chicago and Washington are cooling. Companies should adjust forecasts and resource allocation accordingly.
- Affordability squeeze: Elevated financing costs (~7% mortgage) and high material costs (construction ≈ 64% of home price) mean new-home affordability is tight. Builders may face continued caution in launching projects.
- Policy and Costs: Ongoing tariffs and trade tensions (on lumber, steel, appliances) risk further cost inflation. Staying ahead of policy shifts (e.g. potential tariff changes) will be critical for planning.
- Data-driven strategy: Given the shifting landscape, granular permit data are vital. Tracking permits by metro and housing type can help companies anticipate local market shifts and time product offerings or investments.
Overall, January’s permit figures reflect an industry in transition: modest national pullback amid uneven regional trends. Companies that leverage detailed permit analytics and stay attuned to macro trends (rate policy, material inflation, consumer demand) will be better positioned to navigate 2025’s challenges and opportunities.
Sources: U.S. Census/HUD, NAHB, Reuters, and company analysis.
Raf Howery
Raf Howery is the founder and CEO of Kukun. Howery, a self-professed "serial renovator" and entrepreneur, started Kukun to transform the home remodeling industry from an offline, fragmented, and frustrating undertaking to an online, modern, and user-friendly experience.
Published May 30, 2025