Renovation is Concentrating Where Home Equity is Deepest
Updated Mon, Jun 29, 2026 - 5 min read
Monthly property intelligence for finance and insurance — built on the Kukun property state graph.
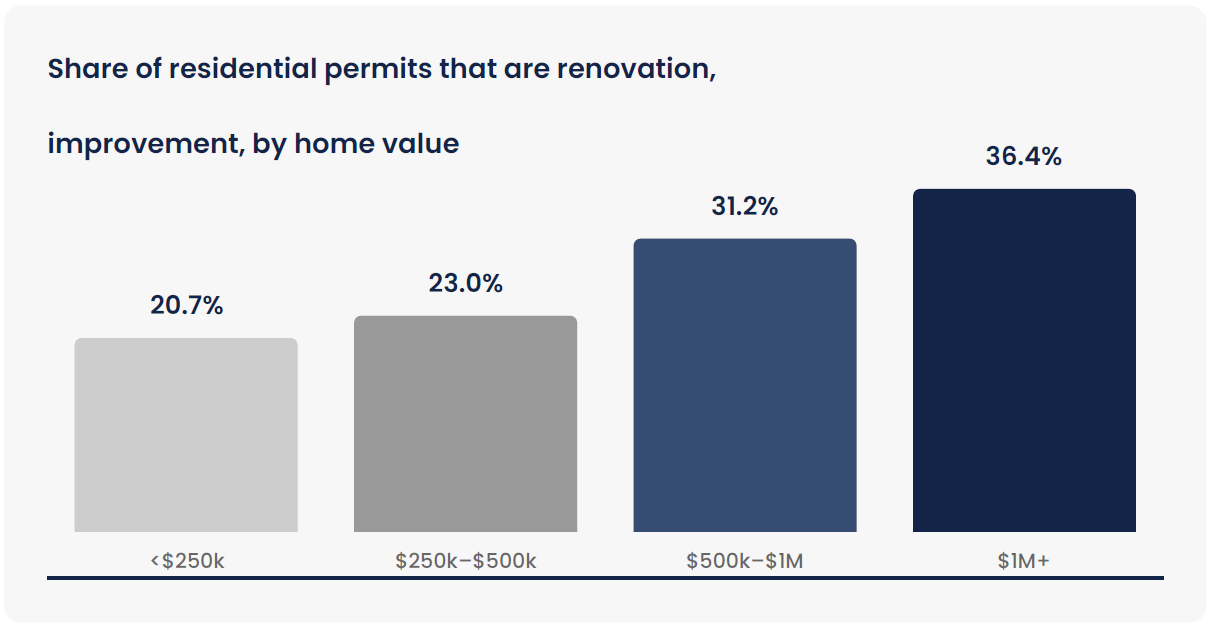
Across the Kukun Regular-Cadence Panel, renovation activity rises in lockstep with home value. In the rolling 90-day window, the share of residential permits representing a renovation or improvement climbs from 20.7% onhomes under $250,000 to 36.4% on homes worth $1 million or more: the highest-value homes, with the most equity to draw on, renovating at roughly 1.75× the rate of the lowest tier. Because a renovation is permitted before the work, before the financing, and before any loan application, it is the earliest visible signal of where home-equity demand is forming.
Renovation is the single largest use of home-equity borrowing in the United States — roughly half of it, per the Census American Housing Survey. The homes renovating today are a forward map of the home-equity demand lenders and servicers will field over the next one to two quarters.
What Homeowners Are Building
The signal is led by discretionary, equity-funded work: additions (19,720), bathroom remodels (18,429), general remodels (11,300), kitchen remodels (10,392), and whole-house projects (4,716). Renovating homes skew established — a median age of 56 years vs 47 for the panel overall.
Value-Tier Performance Breakdown
| Home Value Tier | Residential Permits | Renovation Rate |
|---|---|---|
| Under $250k | 87,216 | 20.7% |
| $250k–$500k | 66,424 | 23.0% |
| $500k–$1M | 32,092 | 31.2% |
| $1M+ | 11,619 | 36.4% |
Where It Is Happening: Metro Analytics
The coastal high-value markets are where renovation is both heaviest and most equity-rich: San Francisco, Newport Beach, and Miami Beach are the densest pockets of HELOC-propensity signal. Volume alone can mislead: Baltimore and Philadelphia post high counts on largely sub-$250k stock. The value mix, not the raw count, separates a HELOC opportunity from ordinary improvement.
| Metro Area | Reno Permits | Reno Rate | Media Value | Share $1M+ |
|---|---|---|---|---|
| Charlotte, NC | 1,522 | 38.1% | $443,600 | 12.8% |
| San Francisco, CA | 1,402 | 64.9% | $739,400 | 30.6% |
| Los Angeles, CA | 1,327 | 36.9% | $481,200 | 19.5% |
| Raleigh, NC | 834 | 36.0% | $565,900 | 12.0% |
| Boston, MA | 723 | 54.2% | $388,200 | 9.0% |
| Miami Beach, FL | 355 | 59.1% | $477,200 | 23.7% |
| Newport Beach, CA | 339 | 51.8% | $1,661,400 | 47.8% |
The Market This Maps To: HMDA Benchmark
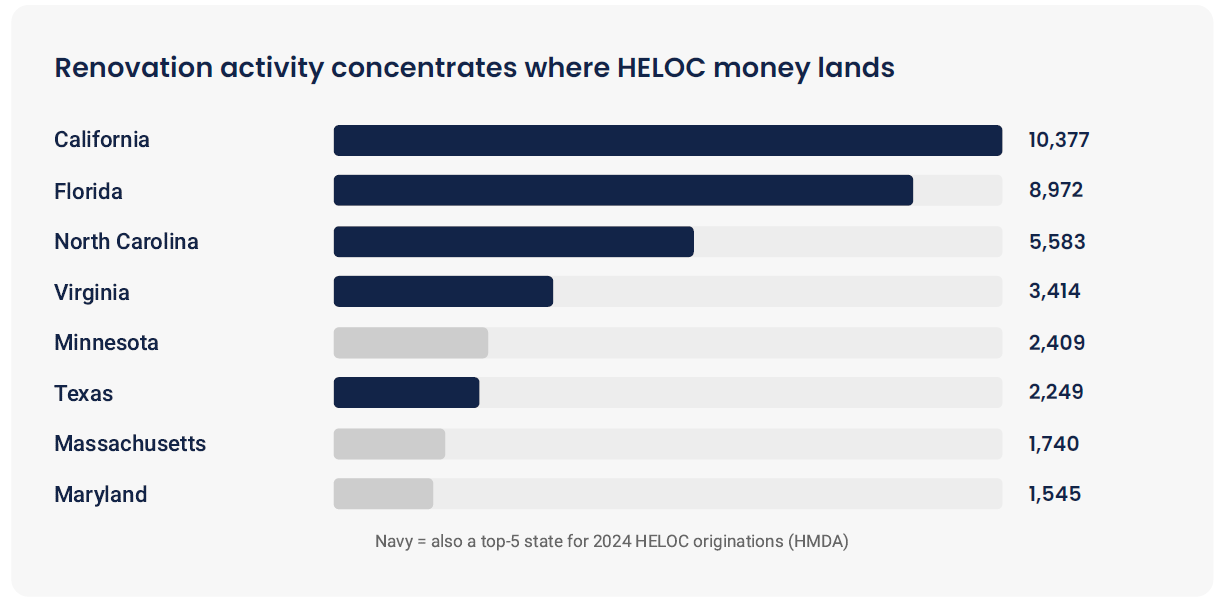
HMDA shows the 2024 HELOC market led by California (509,170 originations/$288B), Texas (491,716/$172B), and Florida (474,589/$170B). The panel’s renovation signal is densest in California and Florida (among the top HELOC markets), so where the panel reports most heavily, renovation and realized HELOC borrowing line up, and the permit arrives first.
Let's connect, and see how we can help you stay ahead of the market.
Contact us
This is a single-family renovation signal (single-family homes are the bulk of HELOC collateral), and the panels span the major HELOC markets: Texas, Florida, California, and the Carolinas are all well represented.
What HMDA Can’t Tell You
Every lender already has HMDA, and it is the right system of record for what has happened: which HELOCs closed, where, and for how much. What it cannot do is tell a lender what to do next. Four critical gaps separate a standard historical record from an actionable market signal:
Backward, Not Forward
HMDA reports loans after they close on roughly a one-year lag. A renovation permit fires 90–180 days before the financing application, trading the rearview mirror for true predictive radar.
Fulfilled Demand, Not Forming Demand
HMDA shows only the loans that have already closed, most won by competitors. A permit reveals intent while the homeowner is forming budgets and is still dynamic in play.
Aggregate, Not Addressable
HMDA data is census-tract-level and completely anonymized. The Kukun renovation signal lands directly on a specific property, matchable to any active servicing book or prospect file.
Annual Snapshot, Not a Live Feed
HMDA arrives once a year; Kukun renovation permits arrive continuously, maintaining a median processing lag of just eight days behind the municipal record.
Portfolio Impact & Playbook Strategy
The value of this market-level read to an individual lender or servicer is immediate execution. Because the exact same renovation signal that rises with home value across the panel resolves, at the address level, to specific homeowners entering a home-equity decision 90–180 days early.
For Originations
Because the signal is address-level, marketing teams can instantly match renovating homeowners against customer or prospect databases. Direct pre-approved offers, mail, and digital campaigns reach the customer months before a standard credit inquiry fires. Lower customer acquisition costs and higher conversions are won by the lender who engages first.
For Servicing & Runoff Defense
The implication here is sharper: portfolio retention. Equity-rich homeowners renovating inside your serviced book are active targets for competitors. Standard files track runoff only after it occurs; Kukun permits identify intention months ahead, documenting address, value tier, and specific project type.
Core Operational Directives
Retention Screen
Intercept portfolio runoff by evaluating the active serviced book against continuous weekly permit drops.
Cross-Sell Prioritization:
Rank opportunities systematically. A whole-house permit on a $1M+ property indicates a completely distinct asset deployment opportunity compared to a basic bath remodel.
Continuous Monitoring
Screen portfolio dependencies on a standing basis via our 8-day median data pipeline.
Methodology Note:
Residential building-permit activity within the Kukun Regular-Cadence Panel — a deliberately selected set of jurisdictions with verified, consistent single-family reporting (city- or county-level); rolling 90-day window; median data lag 8 days (15 days p90); counts reflect city-issue dates. “Renovation/improvement” = kitchen, bath, whole-house, general remodel, and addition permits. Home value (market value; assessment fallback; 86% populated) is an equity-capacity proxy — no loan balances, so figures show the renovation-to-value relationship, not literal LTV. The 90–180-day lead time is an expected interval from the permit-to-financing sequence, not measured in this single window. The headline value-tier finding is panel-wide. HMDA 2024: FFIEC/CFPB, open-end lines, originated. Kukun Research © 2026. All rights reserved.
.
Raf Howery
Raf Howery is the founder and CEO of Kukun. Howery, a self-professed "serial renovator" and entrepreneur, started Kukun to transform the home remodeling industry from an offline, fragmented, and frustrating undertaking to an online, modern, and user-friendly experience.
Published June 21, 2026
Top business articles
Other articles by this author
Contact us
Join Property Signal
Kukun's monthly index on where home-equity demand is forming next. Built on national permit data.
Please enter a name
Please enter a valid e-mail