Where Your Next HELOC Borrowers Are Renovating: The July Read
Updated Mon, Jul 6, 2026 - 6 min read
Kukun Property Signal · July 2026
Property Signal · July 2026
The monthly read from Kukun built on the property knowledge graph (permits, condition, contractor, renovation cost). This month: where renovation is concentrating, and why it’s the earliest map of home-equity, personal loan, and credit card spend demands.
First, zoom out: the country isn’t doing one thing
Read a month of building permits across the country and the striking thing is how differently each region behaves. Some states are building new construction dominates their permits (Texas, North Carolina), where purchase and construction-loan volume forms. Some are maintaining systems work like HVAC leads (Michigan, Nevada), the stuff of home-improvement lending. Some are bracing for risk roofs and pools (Florida, Minnesota), the exposures carriers’ price. One month, five different jobs, one map.
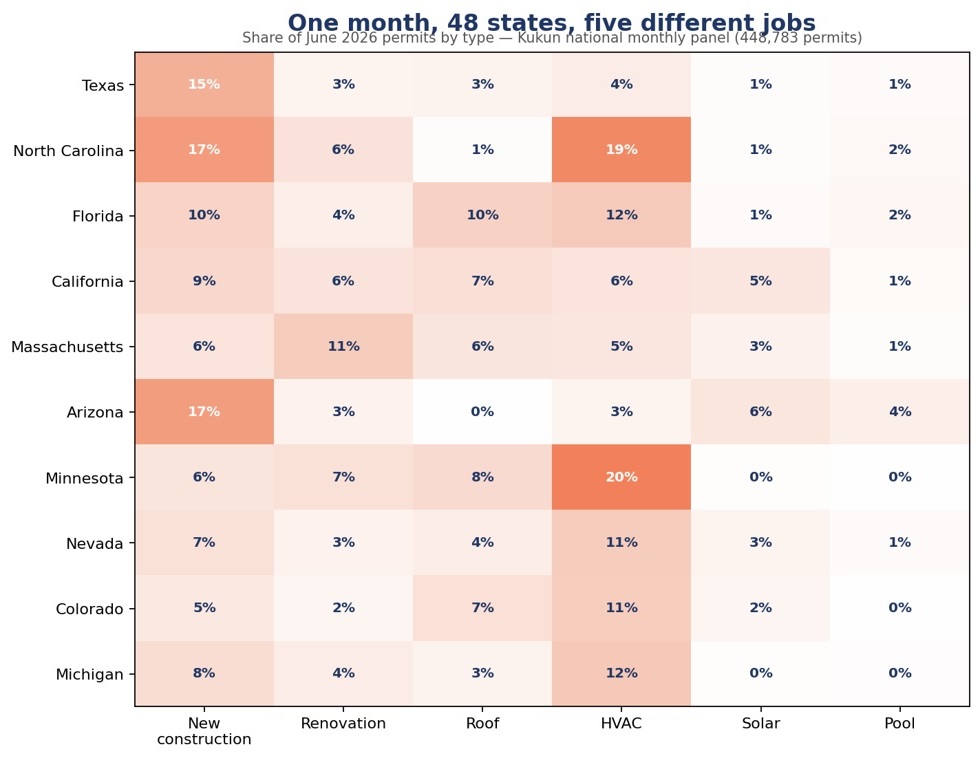
For a lender, one of those five jobs matters more than the rest because it names a future borrower before the borrower knows it. That job is renovation.
A permit isn’t one loan. It’s a financing cycle
Renovation is the single largest use of home-equity borrowing in the United States. Roughly half of it, per the Census American Housing Survey. But the costly mistake is treating a renovation as a single financing event; one HELOC, at the end. It isn’t. A permit opens a multi-stage financing journey:
Let's connect, and see how we can help you stay ahead of the market.
Contact us
- Start. By the time a permit is pulled, the homeowner has usually already lined up initial money, such as their savings, a credit card, or, increasingly, a personal loan, because a personal loan lets them start fast without having to go through the long process of a home equity loan.
- Middle – scope creep. Projects get added; material tastes move upmarket. The budget grows mid-build, and the homeowner borrows again.
- End – consolidation. The finished home is worth more, so the homeowner refinances or consolidates everything into one loan against the new equity, the cash-out refi or HELOC.
That’s three lending moments, not one, and the permit is the trigger that starts the clock on all of them. The lender who waits for the HELOC application to arrive last, at the most competitive moment. The lender who sees the permit can be present from the first dollar and stay close through the top-up and the consolidation. Staying close across the whole cycle (not a single touchpoint) is the difference between originating the relationship and buying the lead.
In our inaugural issue, we showed who renovates: renovation activity rises in step with home value and the equity behind it. This month’s read answers the other half, where that renovation is concentrating right now.
Two maps of renovation, and why they disagree
“Where is renovation happening?” has two answers, and a lender needs both. Rank states by renovation volume, the raw number of homes pulling remodel and addition permits, and the biggest borrower pools are where you’d expect: California, Florida, North Carolina, and Texas. That’s the size of the HELOC opportunity.
But rank by rate (renovation’s share of a state’s permits) and the list reshuffles. Florida and Texas fall below the national average: their permits are dominated by roofing, HVAC, and new construction, so renovation is a thin slice of a big pie. Meanwhile, Massachusetts renovates at 2.8× the national rate, with Minnesota, South Carolina, and Oregon also punching well above their weight.
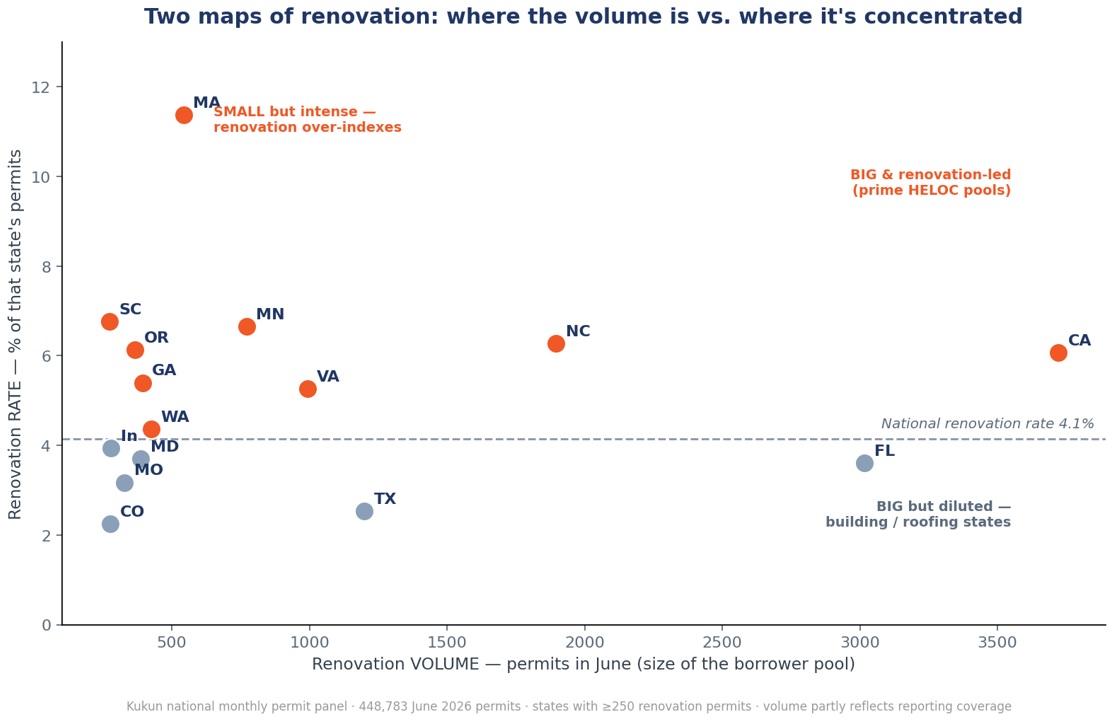
The gap between the two maps is the strategy. Volume tells you where the most borrowers are, and where every lender is already competing. The rate tells you where renovation is the dominant story, often in less-contested markets. The sweet spot is the upper right: California and North Carolina are both big and renovation-led. Chase Florida and Texas for scale; mine Massachusetts and Minnesota for concentration.
Zoom to the metro level, and the pockets get sharper still. The densest renovation markets this month:
| Metro | Renovation share of permits | Read |
|---|---|---|
| Austin, TX | 12.8% | Top metro by renovation ~$591k homes |
| Boston, MA | 15.6% | Older, equity-rich stock, the leading renovation state |
| Raleigh, NC | 9.1% | Higher-value homes (~$623k median). Deep equity per project |
| Los Angeles, CA | 8.7% | Dense coastal renovation (~$426k median) |
| Charlotte, NC | 7.0% | High volume on higher-value stock (~$532k) |
| Newport Beach, CA | 18.5% | Highest renovation rate: ultra-high-value coastal |
One more layer separates a HELOC opportunity from ordinary improvement: the equity behind it. The homes renovating this month are both older and worth more than the market overall, a median year built of 1971 and a median value of $273,000 versus $239,000 for all permitted homes, with 21% worth over $500,000. That’s the equity a renovation draws on and it echoes what our inaugural issue found: renovation rises with home value.
Especially for card issuers: the spend is about to move
The earliest money in a renovation often runs through a credit card, deposits, materials, and the first contractor invoices. That makes a permit a leading indicator of card spend, not only loan demand. For an issuer, knowing which of your cardholders just filed a permit is a direct signal that a wave of home-improvement spend is coming: the kind that today flows to co-brand programs and big-box retailers like Home Depot and Lowe’s. Reach that cardholder early, and you can capture and protect it: a timely limit increase, a promotional or installment-financing offer, a reason to keep the project on your card instead of a competitor’s personal loan. And because the spend escalates with scope, the issuer present at the permit is positioned to graduate the customer up the ladder card to installment plan to consolidation loan exactly as the cycle unfolds.
What this means for your book
If you originate HELOCs, home-improvement loans, personal loans, or cash-out refinances, or issue the cards that fund the first phase, this is a forward map of demand, visible on the properties you could be lending against before the application lands. The renovation-dense markets above are where that demand is forming this quarter. Pointed at your own footprint, the same signal tells you which of your customers are entering the renovation cycle, and at which stage a competitor is likely to reach them first. The permit is the earliest point in that funnel, and it opens a relationship that runs for quarters, not a single touchpoint. We see it first.
Coming in September: the Renovation-HELOC Index
This monthly read is the current-quarter map. In September, Kukun publishes the first quarterly Renovation-HELOC Index built on the full national monthly panel and benchmarked against HMDA origination volume, quantifying the permit-to-application lead time and sizing the addressable market state by state. If this month’s map is useful, the Index is the atlas.
Subscribe to Property Signal: the monthly permit read for lenders and insurers, plus the quarterly Renovation-HELOC Index. Free. Want it to run against your own portfolio or footprint? Just reply.
One subscription: the monthly permit read for lenders and insurers, plus the quarterly Renovation-HELOC Index. Free.
Want this run against your own portfolio or footprint? Reply to any issue. We’ll show you your map.
Source: Kukun national monthly permit panel – June 2026 permits across 48 states. Renovation = kitchen, bath, whole-home, general remodel, or addition (logical OR); rates are renovation’s share of panel permits. State volume reflects reporting coverage, so we report rates, not raw counts. This is a directional read, not a census of all activity; definitive state-level rates and the HMDA origination benchmark arrive in the September Renovation-HELOC Index.

Raf Howery
Raf Howery is the founder and CEO of Kukun. Howery, a self-professed "serial renovator" and entrepreneur, started Kukun to transform the home remodeling industry from an offline, fragmented, and frustrating undertaking to an online, modern, and user-friendly experience.
Published July 6, 2026
Top business articles
Other articles by this author
Contact us

Join Property Signal
Kukun's monthly index on where home-equity demand is forming next. Built on national permit data.
Please enter a name
Please enter a valid e-mail