Where the risk on your book changed in July
Updated Fri, Oct 23, 2026 - 3 min read
Every month, hundreds of thousands of building permits quietly record something property insurers spend a fortune trying to see: the moment the risk on a home changes. A new roof. A new cooling system. A finished basement. Each one alters the exposure on a policy that’s already in force, and the permit records it days after the city issues it, not months later at renewal or, worse, at claim.
Here’s what July’s permit record showed, and why it matters for the homes already on your book.
Roofs (a leading driver of property loss) are being replaced in clusters, and the map isn’t random. In July, roof permits made up 23.8% of all permits in Minnesota (on more than a thousand permits). The classic upper-Midwest hail signature. Alabama ran a nearly identical 23.2%, with Indiana and Illinois both around 18%. These are storm-driven waves: a hailstorm moves through, and weeks later, the re-roofs show up in the permit record, county by county.
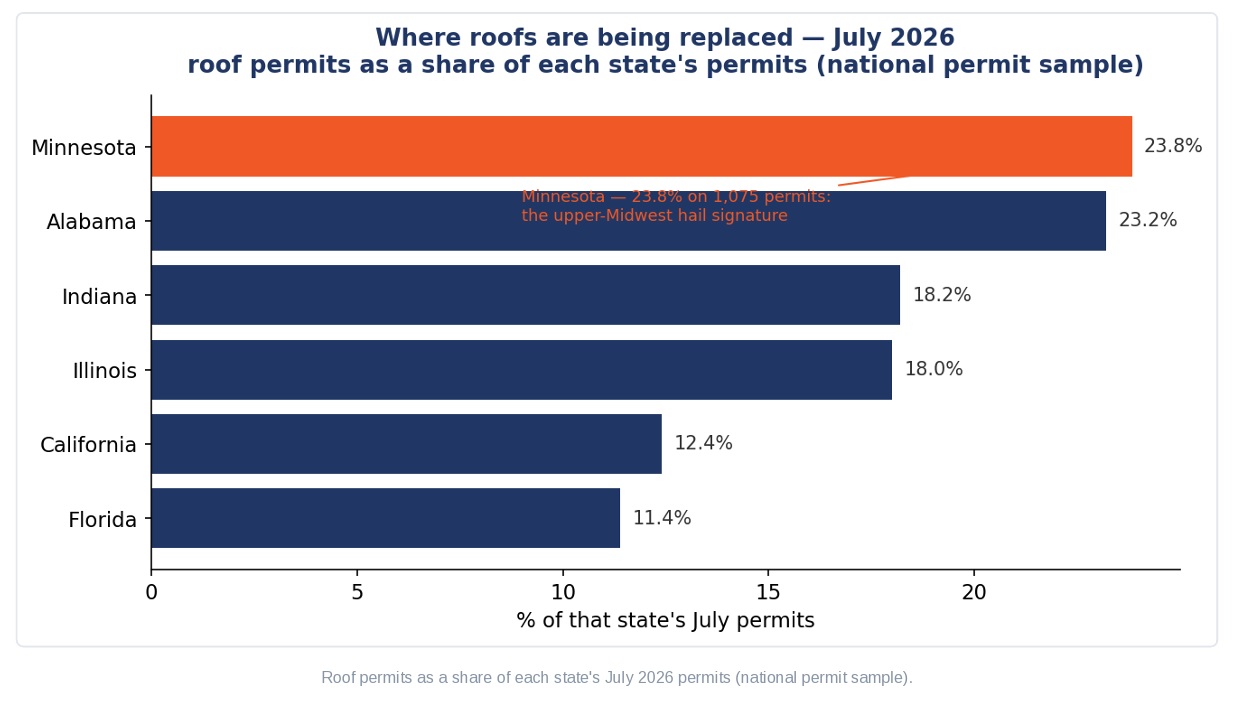
A second pattern is aging stock rather than storms. California (12.4%) and Florida (11.4%) posted high roof volumes too: Los Angeles County alone recorded 712 roof permits in July, Miami-Dade 176. Different cause, same underwriting fact: a roof replaced is a roof whose age, condition, and loss profile just reset, on a home you may still be rating as if nothing changed.
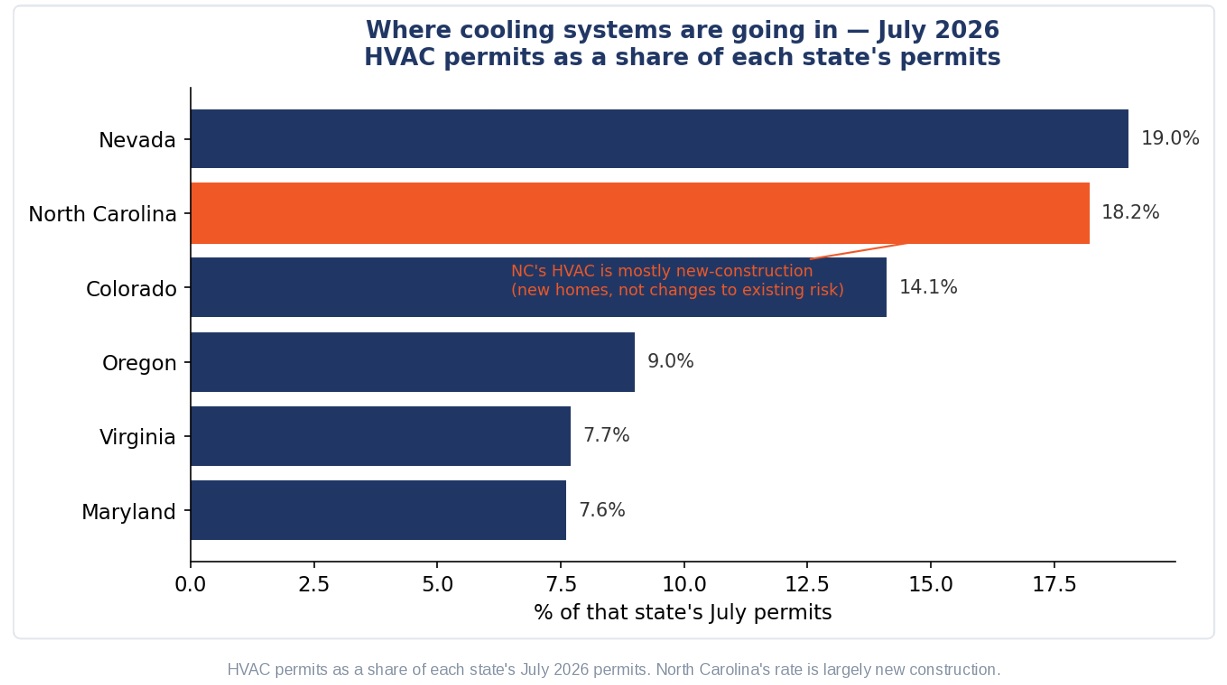
Cooling tells the heat story. Nevada led HVAC activity at 19% of its July permits and Colorado at 14%: systems running hard, and being replaced, through a hot month. That’s both a claims signal (system failures) and a condition signal (what’s actually protecting the home).
One subscription: the monthly permit read for lenders and insurers, plus the quarterly Renovation-HELOC Index. Free.
Let's connect, and see how we can help you stay ahead of the market.
Contact us
But the label alone isn’t enough, and this is the part that matters most. North Carolina’s HVAC rate looks just as high (18%), but North Carolina is a new-construction market: those are systems going into brand-new homes, not changes to risk you already carry. Same permit label “HVAC,” completely different meaning for an underwriter. The question is never just what was permitted; it’s what property it happened to. Is this a change to a home already on your book, or a new build you don’t insure yet? A permit without the property behind it can point you exactly the wrong way.
That’s the whole idea behind reading the permit record this way. A re-roof in Minneapolis, an AC swap in Las Vegas, a finished basement in Denver, each one moves the risk on a specific policy, and each one is on the public record within days. Most carriers meet that change at renewal or at the claim. It doesn’t have to be that late.
We take no position on any of this. We just publish what the permit record shows, at the property level, the week it’s filed. If you underwrite in any of these states and want your own exposure breakdown (which counties, which risk types, on which policies), reply and we’ll pull it.
Methodology. National permit sample, July 2026 (46,274 permits), classified by permit type; rates are the share of each state’s July permits. A one-month snapshot, not a cumulative total. Minnesota, Alabama, and the storm-belt figures are the most robust (largest samples); New Mexico’s 33% roof rate sits on a smaller base. Contact: Raf Howery · raf.howery@mykukun.com

Raf Howery
Raf Howery is the founder and CEO of Kukun. Howery, a self-professed "serial renovator" and entrepreneur, started Kukun to transform the home remodeling industry from an offline, fragmented, and frustrating undertaking to an online, modern, and user-friendly experience.
Published August 3, 2026
Top business articles
Other articles by this author
Contact us

Join Property Signal
Kukun's monthly index on where home-equity demand is forming next. Built on national permit data.
Please enter a name
Please enter a valid e-mail