Permit Pulse: The Borrower, the Risk, and The Inventory
Updated Wed, Sep 30, 2026 - 4 min read
Week of Aug 24, 2026 · Kukun permit data, Aug 10–16, 2026 · 32,219 permits, 46 states · per-state rates, states with n≥250
The Homeowner Who Isn’t Moving
Washington filed home additions on 8.7% of its permits: the highest rate in the country, against a 2.2% national rate. North Carolina (6.0%), South Carolina (5.4%) and Virginia (4.6%) follow it.
Here’s the detail I liked most this week: the median home getting an addition in Washington was built in 1958. That’s not a builder adding square footage to new inventory. That’s somebody in a 68-year-old house deciding to stay in it and make it bigger.
An addition is the stuck homeowner made visible. When moving is expensive, people build up and out instead, and they almost always finance it against the house. The permit is filed months before the HELOC application shows up on anyone’s desk. Not a propensity score, not a model output: an actual homeowner who has committed to spending money at a specific address, on the record, this week. And it’s a homeowner who may already be on your books.
(Fair warning on that 1958 figure: it’s a median across a small Washington additions sample. Treat it as color, not as a benchmark.)
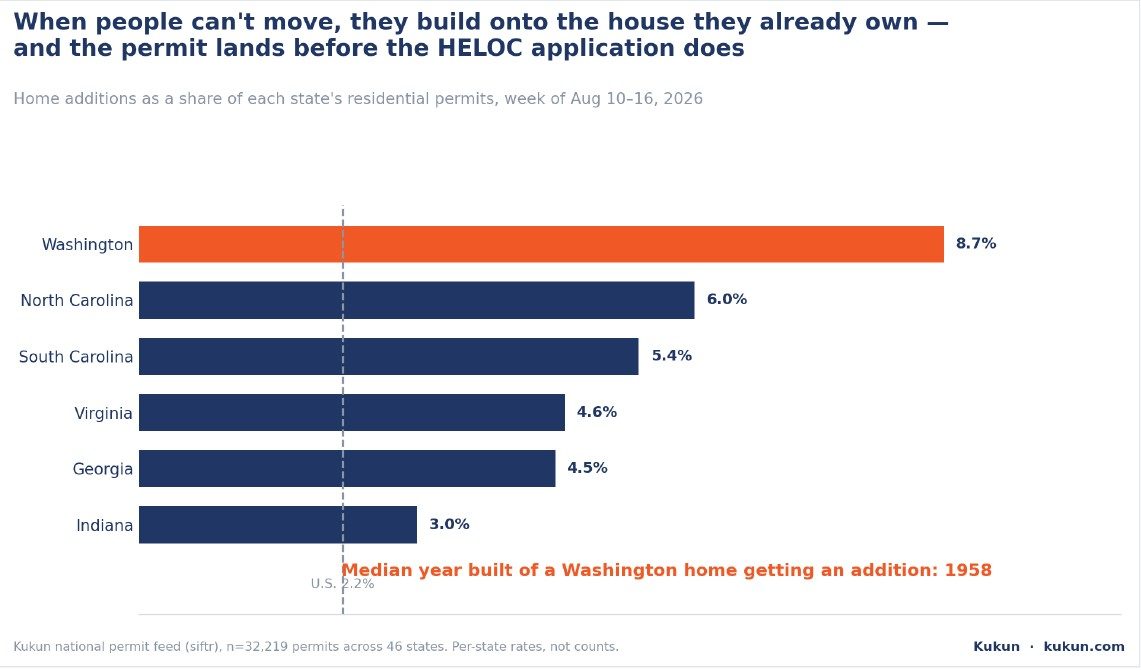
Home additions as a share of each state’s permits, Aug 10–16 2026. Source: Kukun permit data.
Let's connect, and see how we can help you stay ahead of the market.
Contact us
Heat, Hail, and the Label That Lies
Nevada replaced HVAC on 26% of its permits last week. Not 26% more than usual: 26% of everything the state filed. The national rate is 5%. Clark County ran 29%. That’s what a desert heat wave looks like a few days later, in paperwork: a system fails in August in Las Vegas, nobody shops around, somebody pulls a permit. One caveat: the Nevada sample is 382 permits, almost all from Henderson and North Las Vegas. Directionally solid, not a census.
On the roofline: New Mexico hit 38.3% roof, the highest in the country, straight out of monsoon season (small sample, 253 – flag, not finding). Minnesota is the sturdier version: 24.2% roof on 1,050 permits, with siding at 6.6% and windows at 11.2% stacked on top. Hennepin County alone ran 33.5% roof. Roof, siding and windows all moving together in one week isn’t maintenance cycling through; that’s an envelope being rebuilt after something hit it.
Now the part I nearly got wrong. North Carolina’s HVAC rate also looks high: 14.6%. The easy read is “NC is a new-construction market, so those are systems going into new homes, not swaps on existing risk.” Nearly a third of NC’s permits last week (31.9%) were new builds, so it’s a tempting call.
The property join says no. The homes pulling HVAC permits in North Carolina have a median year built of 1995, and 88% predate 2010, and barely any of those permits carry a new-construction flag at all. Same in Nevada: median 1998. These are replacements on existing housing stock in both states.
That’s the argument in one example. “HVAC” is a word. Whether it means a 1995 house losing its cooling or a 2026 house getting its first system is a completely different fact if you’re pricing risk, and you cannot get there from the category name. You need the property underneath it. I almost published the wrong paragraph. The join caught me.
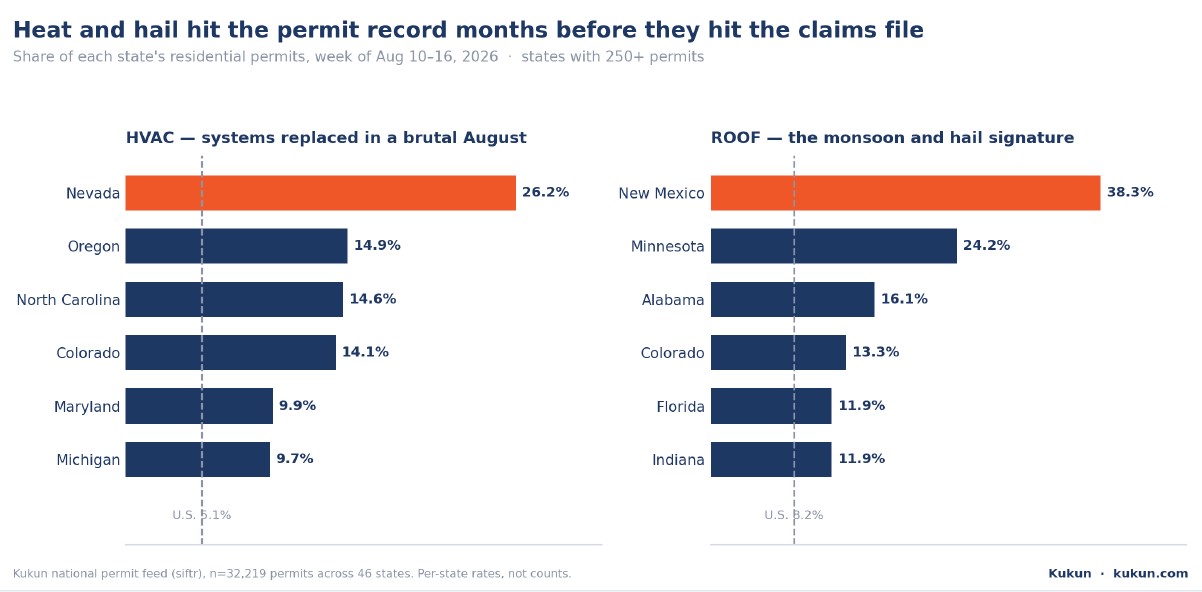
HVAC as a share of each state’s permits, Aug 10–16 2026. Source: Kukun permit data.
Read more: Permit data for lenders the HELOC blind spot
And Where Next Year’s Inventory Is Being Made
One more, for anyone whose job is supply. New construction ran 16.7% of permits nationally, and it is nowhere near evenly spread. Oklahoma (41.6%), Indiana (36.3%), Georgia (35.3%), and South Carolina (34.6%) are each running better than double the national rate.
That’s next year’s listings, next year’s comps, and next year’s absorption problem being created right now, twelve to eighteen months before any of it reaches an MLS.
Three readers, three jobs, one week of permits.
Read more: Not all permit data is created equal
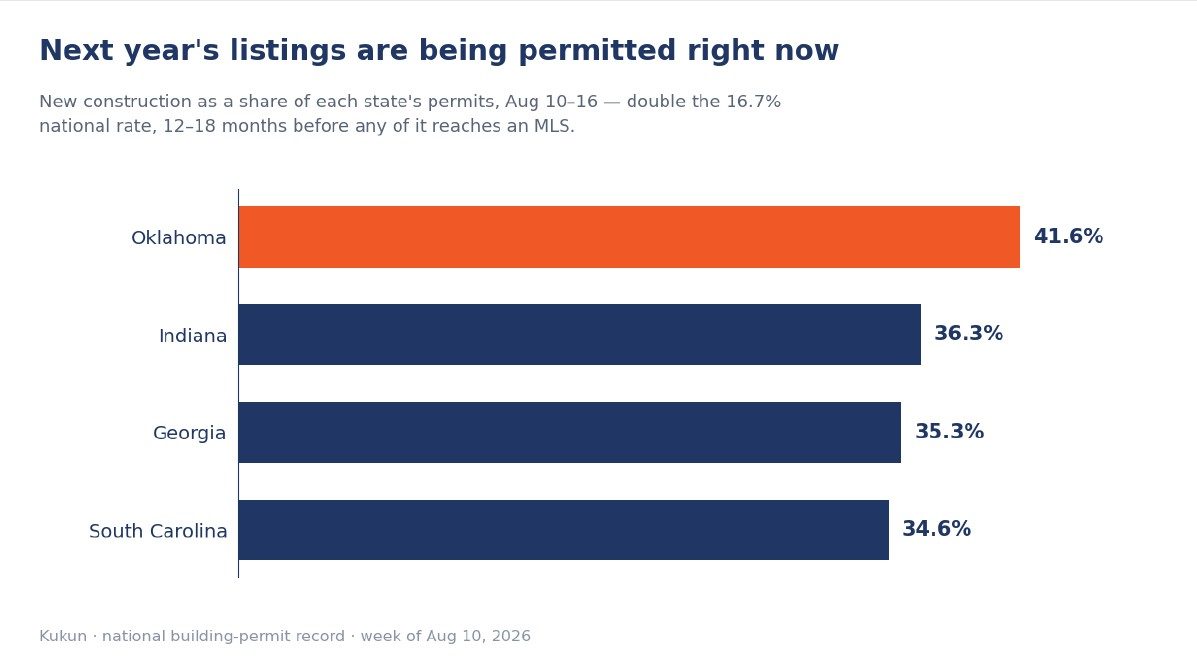
New construction as a share of each state’s permits, Aug 10–16 2026. Source: Kukun permit data.

Kukun Data Team
Home remodeling data at its finest. With expertise in all fields involved in your home, whether is real estate, construction, or remodel, our team of experts is here to walk you through the process.
Published August 21, 2026
Top business articles
Latest articles
Contact us

Join Property Signal
Kukun's monthly index on where home-equity demand is forming next. Built on national permit data.
Please enter a name
Please enter a valid e-mail