The State of Home Investment
Updated Tue, Sep 15, 2026 - 10 min read
Introducing the Kukun Home Investment Index: September 2026
By Raf Howery, CEO, Kukun
Reporting on August 2026 home-improvement activity. Source: the Kukun national permit database (comprehensive collection, the national feed), 490,466 permits across 49 states and 576 counties, every permit joined to the property behind it. This is the first issue of a monthly series; the index starts here.
Every month, hundreds of thousands of American homeowners decide to spend money on the house they already own. They file a building permit before the loan closes, before the contractor breaks ground, and long before any of it shows up in a spending report or a mortgage application. Add those permits together, and you get the earliest, widest picture there is of where private capital is flowing into the existing housing stock, a number no survey and no lender-side dataset can see, because it forms before the money moves.
That is what this series measures. Starting with this issue, Kukun will publish the Home Investment Index (HII) every month: a single reading of how much homeowners are investing in existing homes, built from the permit record and anchored to the property behind each permit. This first issue sets the baseline (August 2026 = 100.0) and lays out what the index is made of. From next month, the number moves, and the movement is the story.
Here is what August looked like.
The headline: ~$4.5 billion, and a median of $9,000
In August, existing-home improvement permits in the Kukun national panel carried an estimated $4.5 billion of declared and imputed project value across 327,850 permits. (The hard floor, dollars actually written on the permit, is $3.17 billion; the rest is imputed from category medians where a jurisdiction doesn’t publish a job cost. More on method at the end.)
Let's connect, and see how we can help you stay ahead of the market.
Contact us
But the number that tells you what home investment actually is sits underneath the total: the median existing-home improvement project in America last month was $9,000. Not ninety thousand. Nine.
That gap (billions in aggregate, thousands per project) is not a rounding artifact. It is the single most important fact about this market, and it is where the index begins.
Finding 1: Home investment is a barbell, not a bell curve
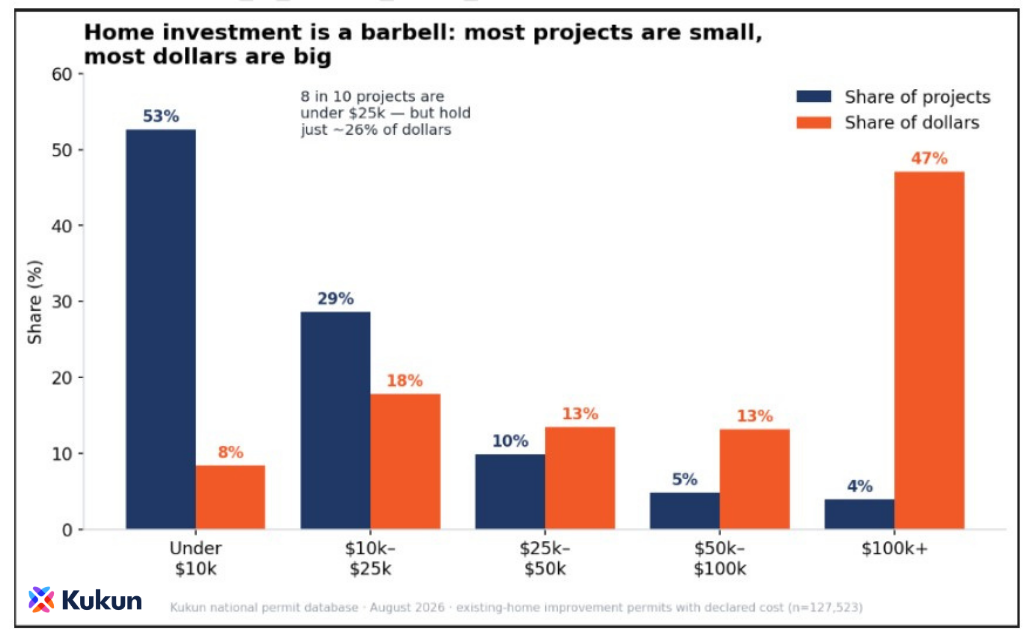
(Lead chart above carries this section, the barbell.)
Split August’s projects by declared cost and the market cleaves in two.
At one end, 53% of all projects came in under $10,000, and 81% under $25,000: HVAC swaps, re-roofs, window jobs, decks, water heaters, small remodels. Together, that entire majority of the market accounts for only about 26% of the dollars.
At the other end, projects over $100,000 were just 4% of the count, but carried 47% of the dollars. Add everything above $50,000, and you have under 9% of projects holding roughly 40% of the money.
So there is no “typical” home-improvement project. There are two markets wearing one label. One is enormous by volume and small by ticket, the recurring, maintenance-and-upgrade spending that nearly every homeowner does and that almost never touches a lien. The other is a thin band of high-ticket transformation (additions, pools, whole-house remodels) that carries the aggregate dollar figure but happens on a small fraction of homes.
That split isn’t bad news for lenders; it’s a map of two different opportunities. The thin high-ticket end is the secured-lending market: additions, pools, whole-house remodels, the projects that justify a HELOC or a renovation loan. It’s small by count, but it’s findable (which is Finding 2: the vast middle): millions of homeowners a year spending five figures or less on homes they have real equity in, reaching for cards, personal loans, or contractor paper because no one offered them anything better at the right moment, is the largest, least-served pool of home-improvement demand in the country. It’s not unlendable. It’s unreached. And the permit is the earliest place either one shows up, before the card is swiped, before the application is filed.
That is the reading the index is built to track: not just how much, but what kind, and whether the barbell is tightening or spreading month to month. (What each lender actually does with it is spelled out below.)
Finding 2: The money is far more concentrated than the map suggests
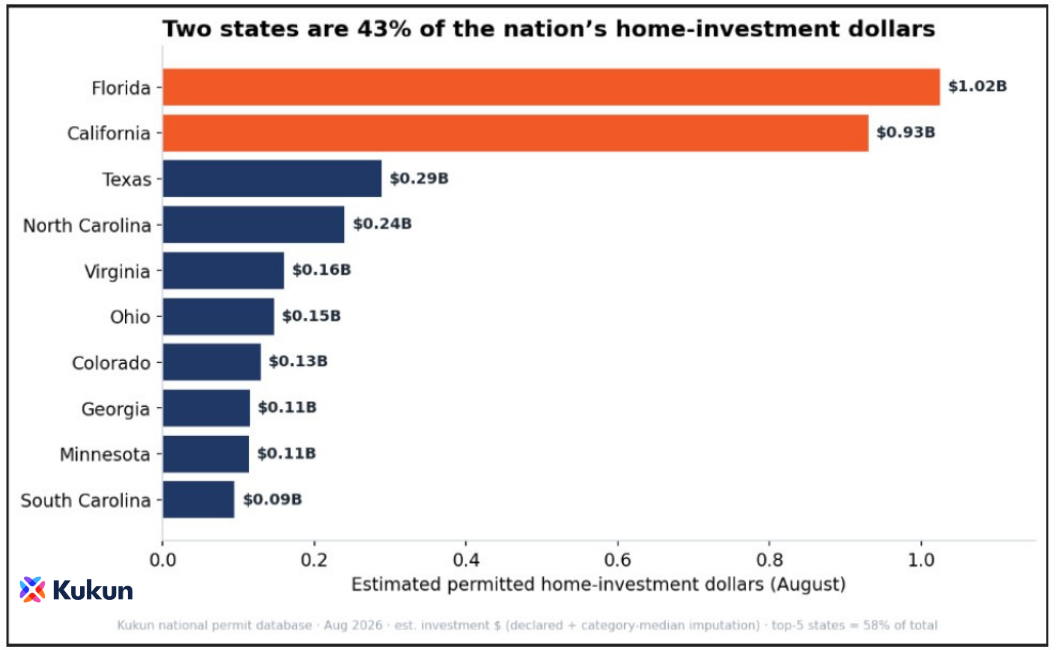
Home investment is often described as a national tide. It isn’t. In August, two states: Florida (23%) and California (20%), accounted for 43% of the nation’s home-investment dollars. The top five states (adding Texas, North Carolina, and Virginia) reached 58%.
It concentrates further down at the county level. Of the 576 counties with activity in the panel, the top 25 counties held 41% of the dollars, led by Los Angeles, Miami-Dade, and Wake County, North Carolina. A market that looks continuous on a map is, in dollar terms, a short list of metros.
Two forces are stacked here. Florida and California are large, high-cost, high-equity markets where both the volume and the per-project ticket run high: aging Florida stock being hardened and re-roofed, California retrofits on homes worth multiples of the national median. The concentration isn’t a data gap; it is where the value density of American housing actually lives.
For a lender, that turns “where do we start” into a short answer. A property-level permit signal doesn’t have to cover the country to move the number; most of the dollars sit in a knowable list of states and counties. Filter to them, and you’ve isolated the majority of the addressable market before wiring in a single new market. This is the map for where to point a prospecting or monitoring effort first.
Finding 3: A few categories move the whole number
The barbell has a mirror image in the category mix: the projects that drive the dollar total are not the ones you see most often.
Additions were 1.8% of projects but 9.7% of dollars. Pools were 1.4% of projects and 6.6% of dollars. Whole-house remodels were four-tenths of one percent of projects and nearly 5% of dollars. These are the leverage categories, rare events with large tickets that swing the aggregate. When the index moves in a given month, it will usually be because this thin top layer thickened or thinned, not because the broad base shifted.
The high-frequency categories tell the opposite story. HVAC (11.9% of projects), electrical (10.2%), plumbing (8%), and roofing (6.8%) are the connective tissue of the market, constant, essential, and modest in ticket. They are where the count lives and where the recurring, unsecured-financeable demand concentrates. Solar sits in between: 2.8% of projects, 5.4% of dollars, and (as we’ve flagged before) a category whose meaning depends entirely on the property under it (a retrofit on an owned home is a different borrower than a panel package on a new build).
Reading count against dollars is the discipline the whole index rests on. The label alone: “addition,” “HVAC,” “solar”, tells you neither the size of the check nor the kind of homeowner writing it. The property does. And it’s what lets a lender sort the two markets apart: the leverage categories point to the secured, high-ticket book; the high-frequency categories point to the mid-ticket, unsecured demand that no product is aimed at yet.
What a lender does with this
The barbell means two different things depending on which end of it you lend into, and both are moves you can make now, not conclusions to admire.
If you’re a secured lender: HELOC, cash-out, renovation loans. Your market is the thin high-ticket end, and the value of reading permits is that it makes that end findable early. Additions, pools, whole-house remodels, and other $50k-plus projects are a small, specific slice of the count; they concentrate in the categories and counties above, and each one is on the public record months before the homeowner applies anywhere. Two concrete uses: prospecting, a filtered permit feed (leverage categories × higher project value × your footprint) is a pipeline of financeable projects ahead of the application; and portfolio monitoring, a large permit on a home where you already hold the first lien is both a cross-sell trigger and an early collateral-value signal. You are not competing for a shrinking pool; you are reaching a known one sooner than the lender who waits for the application.
If you’re a mid-ticket or unsecured lender: cards, personal loans, POS and contractor financing, home-improvement fintech. The middle of the barbell is the opportunity. Roughly half of all projects fall in the $10k–$50k band: homeowners with real equity who finance with a card or contractor paper because nobody put a better-priced, lower-friction product in front of them at the deciding moment. The permit is that moment. The move is permit-triggered acquisition: a pre-qualified offer timed to the filing, when intent is highest, and no competitor is looking yet. This is the largest under-served financing market in housing, and the permit record is the only place it surfaces early enough to act on.
The negative read of the barbell (“most of this is too small to lend against”) only holds if the product and the timing stay where they are today. Change either, and the same chart is a demand map.
What it means, and what we’ll track
Three things stand out in the baseline month, and each is something a month-over-month index will let us watch rather than guess at:
The barbell is the structural fact of home investment, and its shape is a demand signal. If the sub-$25k base swells, that is a wave of small, unsecured-financeable projects forming, the market most lenders can’t see. If the $100k+ tier thickens, that is high-ticket transformation and secured-lending demand building. The index will separate the two.
Concentration means a property-level signal doesn’t have to be everywhere to be valuable; most of the dollars sit in a knowable short list of states and counties. That is where reading permits at the property level pays for itself first.
And the mix is an early read on confidence: additions, pools, and whole-house work are discretionary, financed, and forward-leaning. When that layer grows, homeowners are committing to their homes for the long run. When it thins, they’re pulling back to maintenance. We’ll be watching which way it goes.
We take no position on any of it. We publish what the permit record shows, at the property level, the month it’s filed. That’s the index, and now that the meter is running, the next issue is about the move.
If you lend, underwrite, or build products around home improvement and want your own footprint cut from the August panel (by state, county, category, or project size), reply and we’ll pull it.
Methodology: Kukun national permit database (comprehensive collection), permits with an August 2026 status date: 490,466 permits, 49 states, 576 counties. The Home Investment Index is built on the existing-home improvement subset: residential building category, excluding new construction and new-construction ADUs (327,850 permits). “Declared value” is the city-assigned job cost, populated on 38.9% of these permits (n=127,523, trimmed to $1–$5,000,000 to remove commercial-scale and error records); the median and the barbell distribution use declared values only. The ~$4.5B total and the dollar-mix and geography figures add a category-median imputation for permits without a published cost, and are labeled estimates. The index is anchored at August 2026 = 100.0, defined as estimated home-investment value per active county in the panel (panel-robust, so adding jurisdictions does not inflate the reading). New-construction activity (30,747 residential new builds in August) is reported separately and excluded from the index. A one-month baseline; earlier months in the collection file are still settling and are not used for trend. Rates and dollars describe the permits in Kukun’s national database, not a census of all U.S. permits.

Raf Howery
Raf Howery is the founder and CEO of Kukun. Howery, a self-professed "serial renovator" and entrepreneur, started Kukun to transform the home remodeling industry from an offline, fragmented, and frustrating undertaking to an online, modern, and user-friendly experience.
Published September 15, 2026
Top business articles
Other articles by this author
Contact us

Join Property Signal
Kukun's monthly index on where home-equity demand is forming next. Built on national permit data.
Please enter a name
Please enter a valid e-mail