The Kukun Renovation-HELOC Index • Q3 2026
Updated Tue, Oct 20, 2026 - 6 min read
By Kukun Research • Inaugural edition
What the Index Is
The Kukun Renovation-HELOC Index scores every ZIP code, county, and state on how likely its homeowners are to take out a home-equity loan next, relative to the average for its market. A score of 100 represents the market average. A score of 200 indicates that geography is forming home-equity demand at twice the rate of its neighbors; 50 means half.
The score is derived from one proprietary input: the building permit, joined directly to the property behind it. Renovation permits per 1,000 homes, weighted by the value of the homes being renovated, divided by the parent market’s average. Because it is a rate rather than a count, a ZIP with 2,000 homes can outscore one with 20,000, and a county in Missouri can outscore one in California. Q3 2026 serves as the baseline; subsequent quarters track movement against it, so a ZIP rising from 90 to 140 represents a measurable intent surge. The index resolves where home-equity marketing dollars should deploy first.
Executive Summary
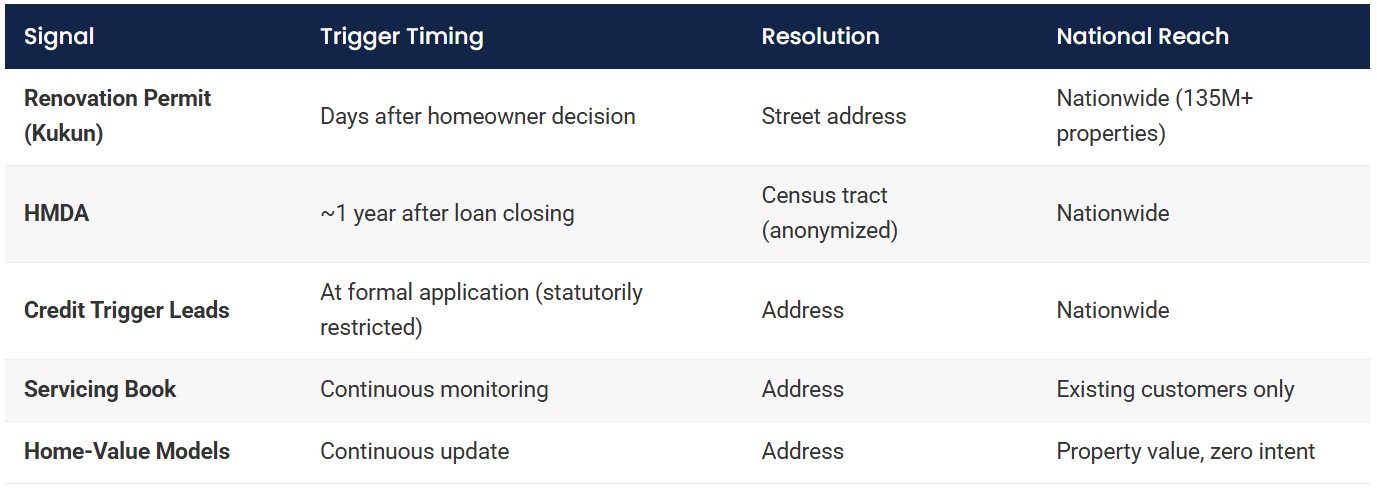
Every lender left MBA Annual with the same plan: expand the home-equity book. When institutions chase identical borrowers simultaneously, the advantage belongs to whoever arrives first and targets most accurately. Conventional targeting maps (HMDA, the servicing book, trigger leads, automated valuation models) lag by a year, confine visibility to existing books, or track non-predictive indicators. The index leverages an early, addressable, nationwide intent signal.
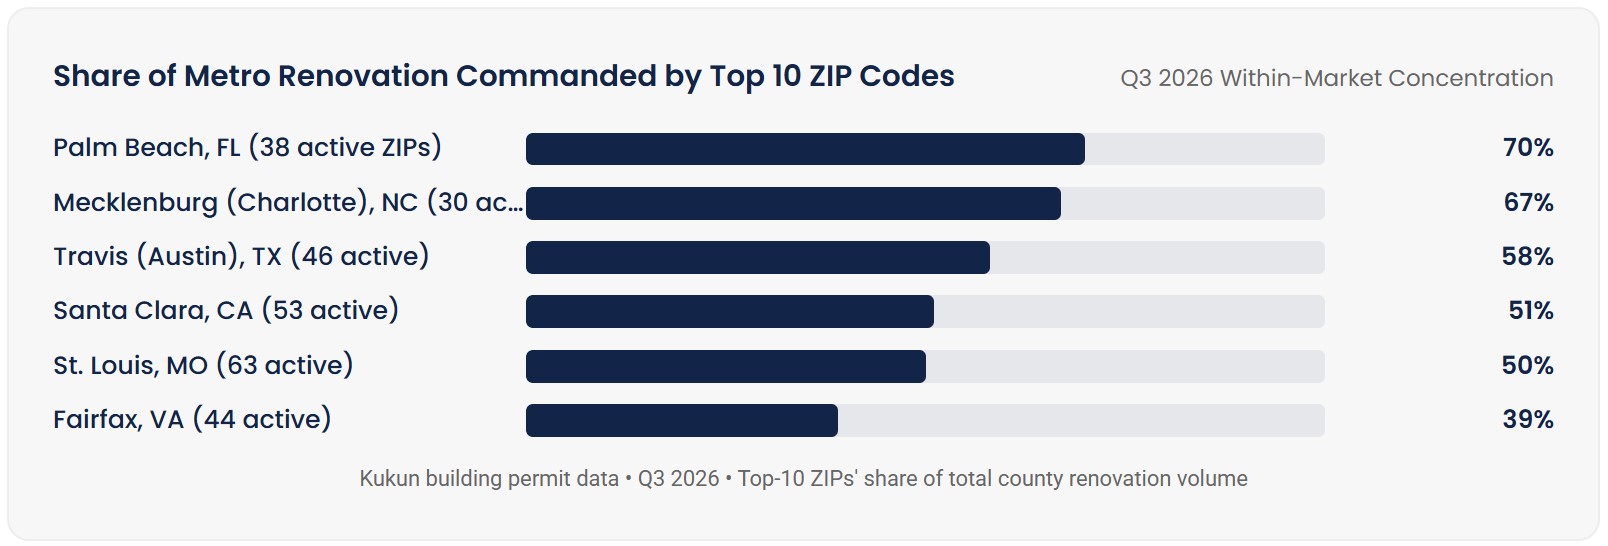
- Demand is hyper-concentrated and uncoupled from superficial wealth signals: Across markets, 5–10 ZIP codes command half to two-thirds of renovation. The wealthiest ZIPs are not consistently the most active: in Fairfax County, Great Falls scores 432 while a busy-on-raw-count neighbor drops to 87 once equity weight is applied.
- The permit observes borrower intent a year ahead of legacy datasets: Public within days of municipal filing, tied to a street address, the permit begins a window extending through completion — when homes reappear at higher, and the heaviest equity draws occur.
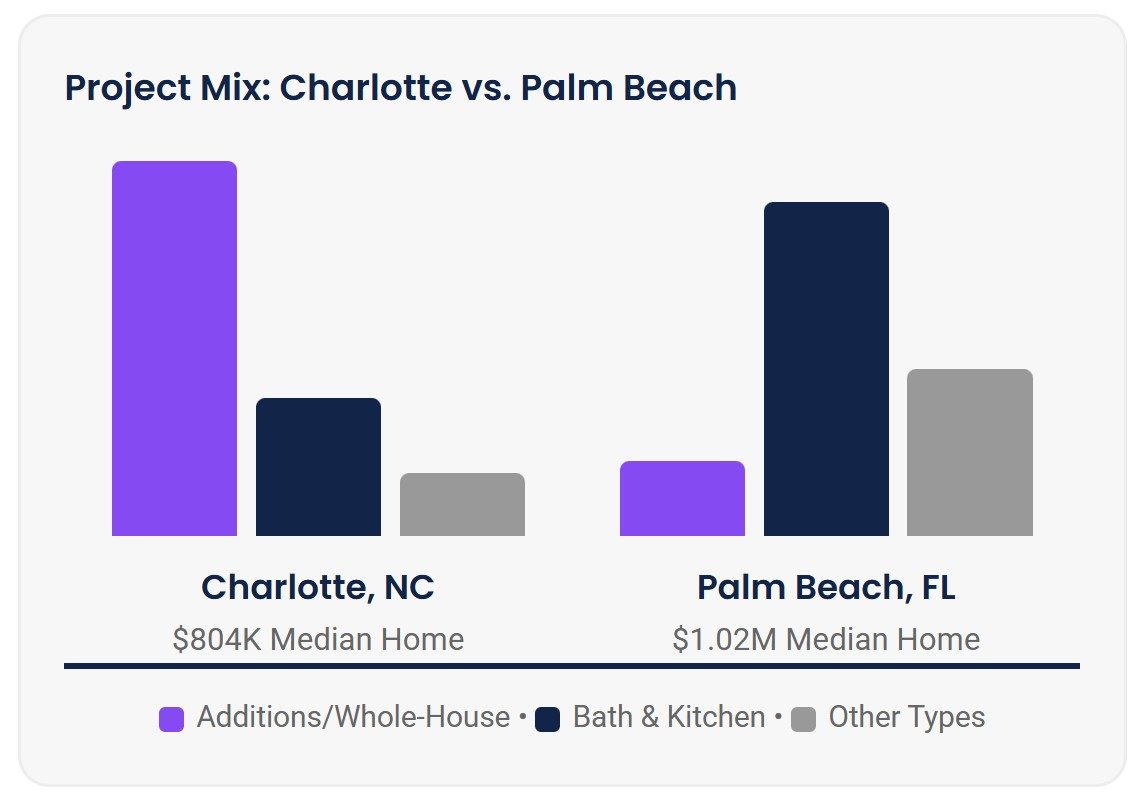
- Superficial indicators mislead project capitalization: Higher home values do not dictate larger project budgets. Palm Beach ($1.02M median) exhibits 58% bath-and-kitchen projects (card-sized), whereas Charlotte ($804K) features 65% additions (HELOC-sized). Concurrently, 33,438 homes added an accessory dwelling unit (ADU) this quarter — invisible in standard category tags and HMDA.
Market Context: A Lock-In-Driven Surge Amid Flattening Breadth
Per ICE’s June 2026 Mortgage Monitor, Q1 home-equity withdrawals hit their highest first-quarter level since 2021, with second liens capturing 54% of all equity extraction — an 18-year record. Homeowners holding first mortgages well below market rates prioritize junior liens over refinancing: 3.9 million borrowers who locked rates between 2020 and 2022 now carry a second lien. As HELOC rates softened to 6.6%, competition has intensified. Simultaneously, unsecured personal loan balances reached $281 billion (+9.6% YoY, TransUnion). Americans are borrowing at records against both their homes and signatures, with home improvement anchoring both.
However, the Harvard Joint Center for Housing Studies (LIRA) projects national remodeling spending growth to slow to ~0.5% by early 2027 — marking three consecutive quarters of deceleration. Flattening spending growth combined with heightened competition makes geographic precision decisive.
Let's connect, and see how we can help you stay ahead of the market.
Contact us
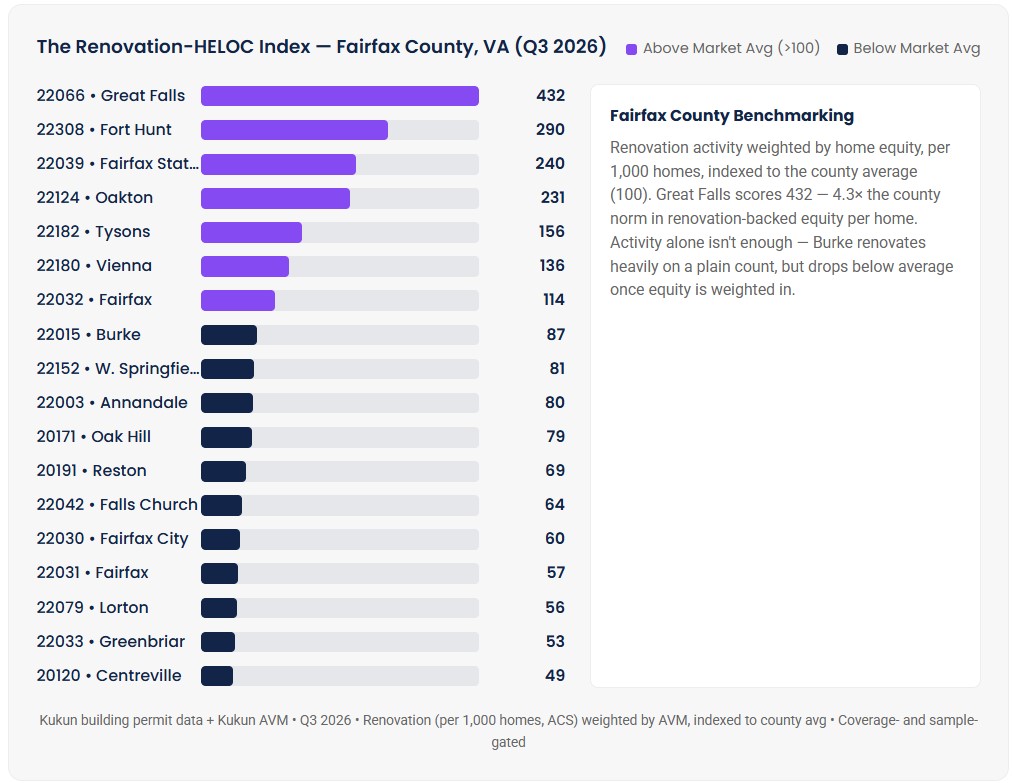
Why Raw Counts Mislead: Index Methodology
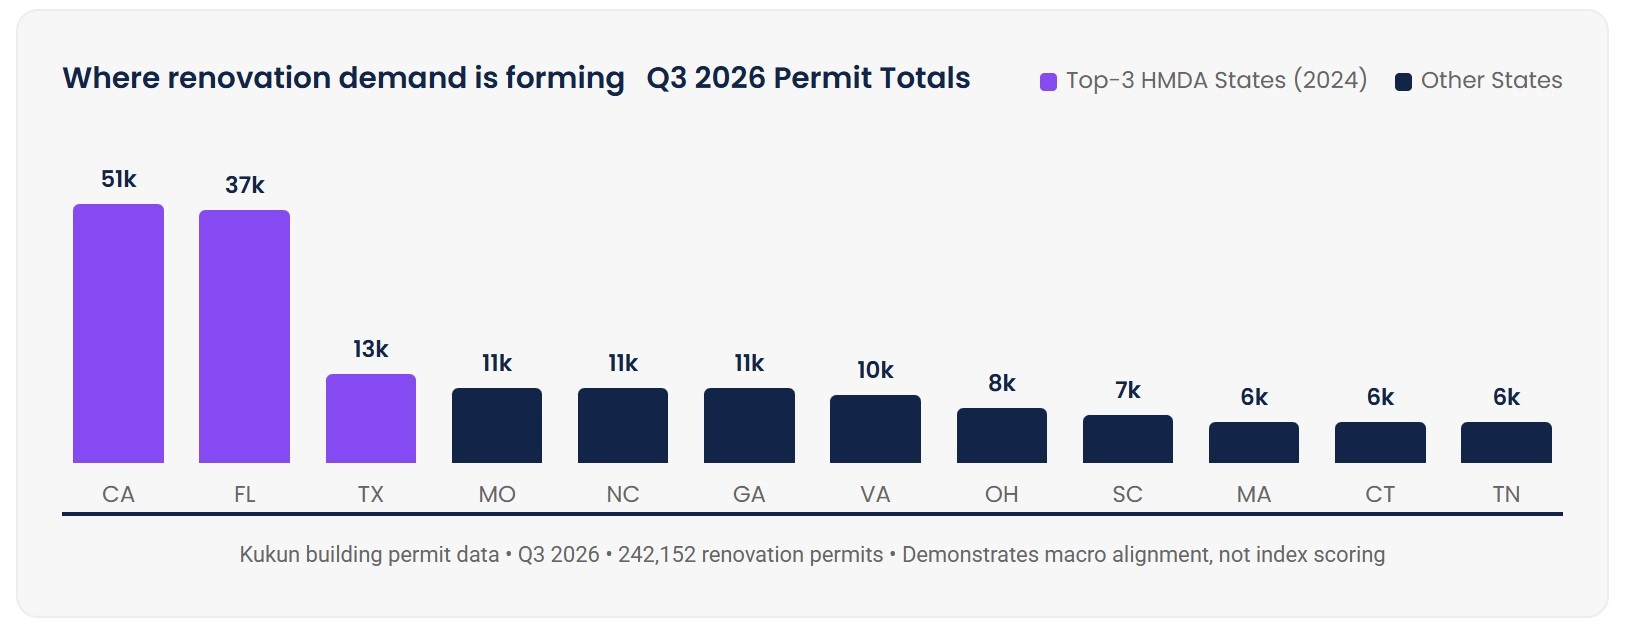
California logged 50,897 renovation permits in Q3 2026, Florida 36,975, and Texas 13,029 — mirroring 2024 HMDA HELOC originations (California 509,170 / $288B; Texas 491,716 / $172B; Florida 474,589 / $170B). Alignment with macro lending validates the signal, but macro counts are unspendable: California contains 14 million housing units and naturally leads gross activity. A lender already knows more volume occurs in Los Angeles than St. Louis. What it lacks is which exact ZIP codes inside those markets merit budget allocation.
The index isolates demand from population bias across three operations: Normalize (permits per 1,000 homes via Census ACS housing stock), Weight by Equity (scaling each permit by the property’s Kukun Automated Valuation Model to evaluate financeable capacity), and Index to Parent (dividing by the local market norm so 100 serves as baseline). Computed within uniform collection footprints and gated by strict coverage thresholds.
Comparative Signal Integrity: Timing and Resolution
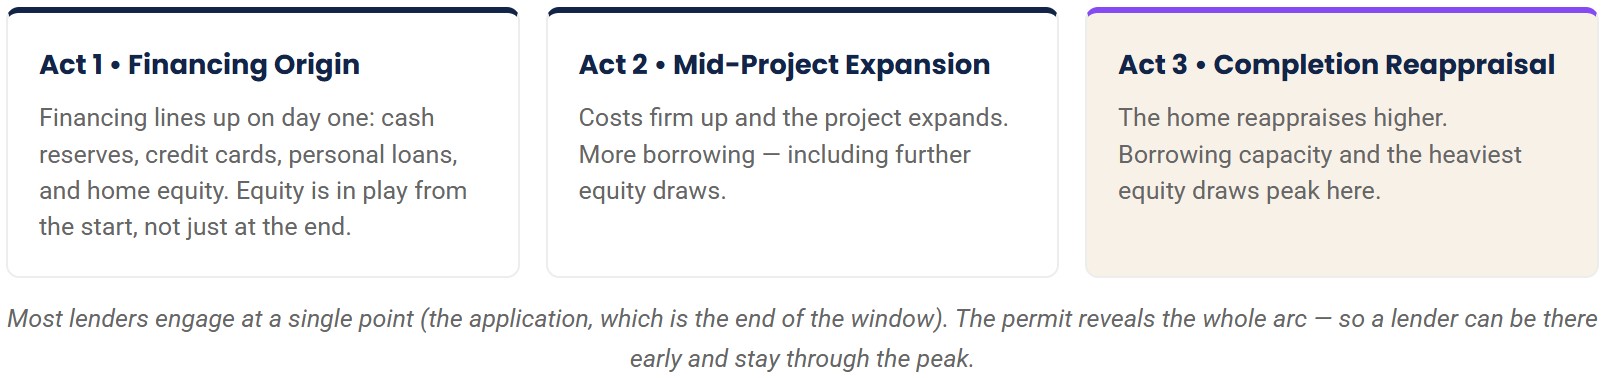
The Three Lending Moments of Renovation
Renovation does not represent an isolated transaction; borrowing builds across a project lifecycle:
Hyper-Concentration Inside Every Metro
Across metro markets, permit activity concentrates heavily within select submarkets:
Valuation vs. Project Scope
Property valuation does not dictate loan size. Palm Beach ($1.02M median home) logs 58% bath-and-kitchen work (card/personal loan scale). Charlotte ($804K median home) logs 65% additions and whole-house renovations (HELOC scale). The remainder (~11% in Charlotte, ~29% in Palm Beach) represents other project types (general remodels, basements, and similar scopes).
The Unlabeled ADU Wave
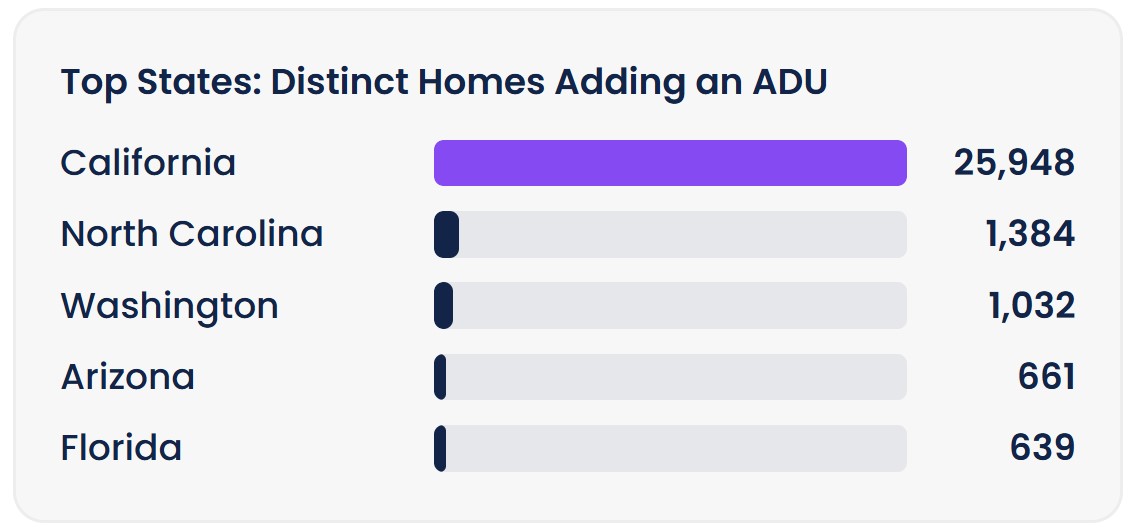
33,438 properties added an ADU in Q3 2026, led by California (25,948; ~5% of state residential permits), followed by NC (1,384), WA (1,032), AZ (661), FL (639), OR (336), MA (305), and GA (269). Standard municipality tags miss these completely; they surface by parsing unstructured permit text. Each represents a $150–300K financing event and a future rental-income stream.
Institutional Playbook
For Mortgage Servicers: Runoff Defense
Screen active servicing portfolios against indexed ZIP codes. Borrowers initiating high-ticket additions or ADUs are prime runoff candidates for competing junior liens. Early engagement prevents asset attrition.
For Originators: Intent Acquisition
Focus acquisition capital strictly on high-scoring ZIPs filtered to owner-occupied properties and major structural scopes. Deploy capital where equity and intent align months before credit inquiries trigger.

Methodology: The Kukun Renovation-HELOC Index is an equity-weighted concentration measure — renovation permits per 1,000 homes (Census ACS 2022 housing units, B25001), weighted by each property’s Kukun Automated Valuation Model (AVM), indexed to the parent geography’s average (100 = average), computed within a geography (ZIPs within a county, counties within a state) where collection coverage is uniform, and coverage- and sample-gated. Underlying data: Kukun national building-permit database, Q3 2026 (July–September), 242,152 renovation permits (Jul 80,803 / Aug 71,133 / Sep 90,216), each joined to its property record. “Renovation” comprises additions, kitchen, bath, whole-house, general and basement remodels and ADUs; permits whose only signal is a generic “general remodel” label with no specific category and no scope-of-work description are excluded. ADUs are identified from permit descriptions and deduplicated to distinct properties. Home values are the Kukun AVM; tax-roll figures are not used. HMDA figures are 2024 open-end/HELOC originations. Macro context: ICE June 2026 Mortgage Monitor, TransUnion Q2 2026 Credit Industry Insights Report, Houzz, and Harvard Joint Center for Housing Studies LIRA. Figures describe permits in Kukun’s national database, not a census of all U.S. permits.
About Kukun: The property knowledge graph for real estate AI, joining building permits, automated valuation (AVM), the PICO™ condition score, renovation cost and property records across 135M+ U.S. properties. Media / data inquiries: press@mykukun.com. Review data services at mykukun.com/white-label-solutions.

Kukun Data Team
Home remodeling data at its finest. With expertise in all fields involved in your home, whether is real estate, construction, or remodel, our team of experts is here to walk you through the process.
Published October 20, 2026
Top business articles
Latest articles
Contact us

Join Property Signal
Kukun's monthly index on where home-equity demand is forming next. Built on national permit data.
Please enter a name
Please enter a valid e-mail