Where America Is Building: The Q3 2026 New-Construction Map
Updated Mon, Nov 2, 2026 - 4 min read
By Kukun Research
Everyone in lending knows the national housing-starts number. It moves markets and makes headlines, and it is almost useless for deciding where to put a dollar. “Starts were up this quarter” tells a construction lender nothing about which submarkets are actually breaking ground — which is the only thing that matters when your borrower is a builder.
So we read the permits instead. In Q3 2026, 178,745 residential new-construction permits were recorded across Kukun’s national database — more than 84,000 of them explicitly single-family homes. Read at the county and ZIP level, that’s not a macro statistic. It’s a map of where ground is breaking right now, and it points somewhere specific.
It’s a Sun Belt story — and a different map than home equity
The states leading new construction are not the states leading home-equity demand. Our Renovation-HELOC Index is led by California and the established coastal metros. New construction is a Sun Belt phenomenon:
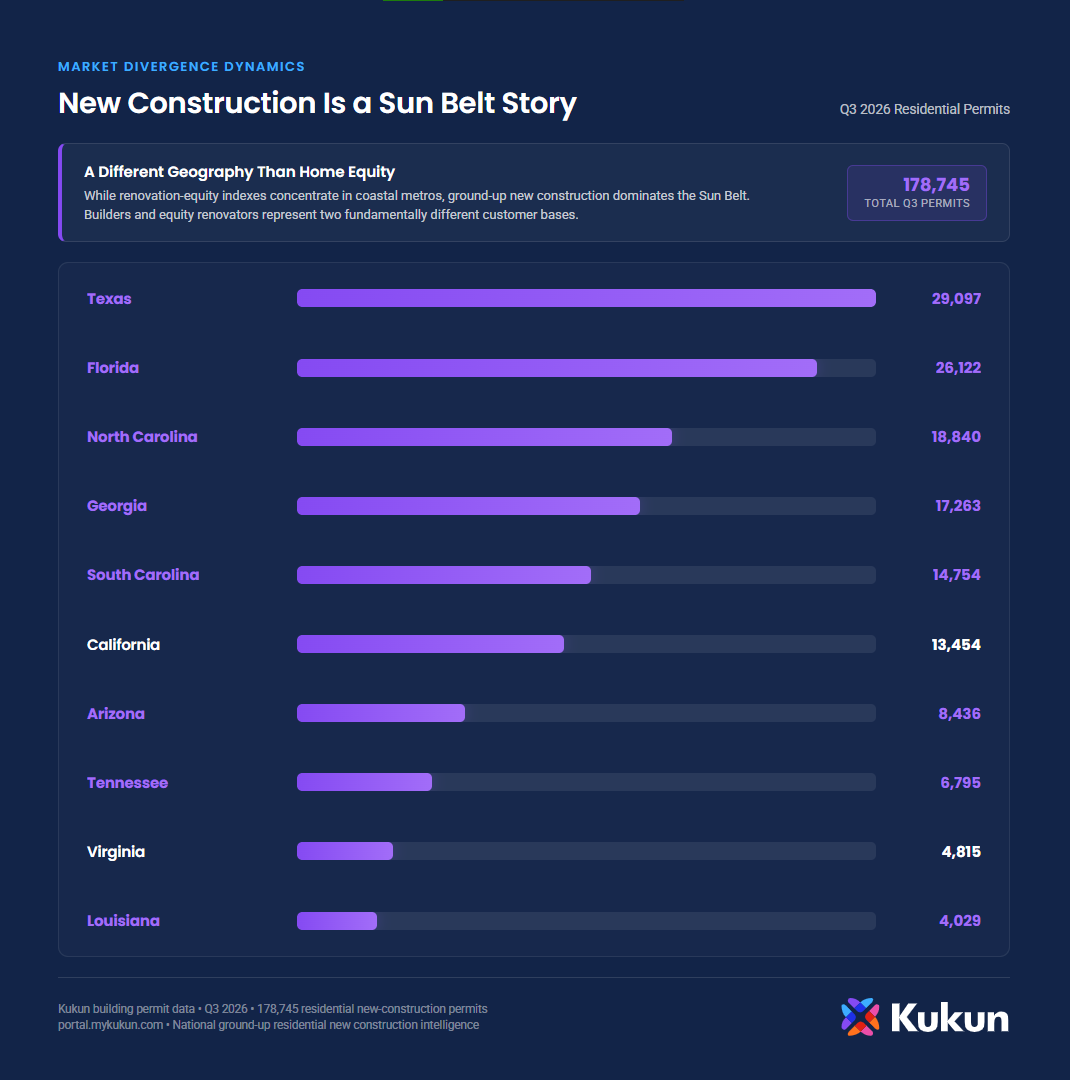
Texas (29,097 permits), Florida (26,122), North Carolina (18,840), Georgia (17,263), South Carolina (14,754), California (13,454), and Arizona (8,436) lead the country. The borrower who renovates an equity-rich home in San Jose and the builder putting up spec homes outside Charlotte are two different customers, in two different places. If you finance ground-up construction, you’re working the second map — and it doesn’t look like the first.
The real edge: it concentrates, hard
The more useful finding isn’t which states build the most — it’s how tightly construction clusters inside them.
Let's connect, and see how we can help you stay ahead of the market.
Contact us
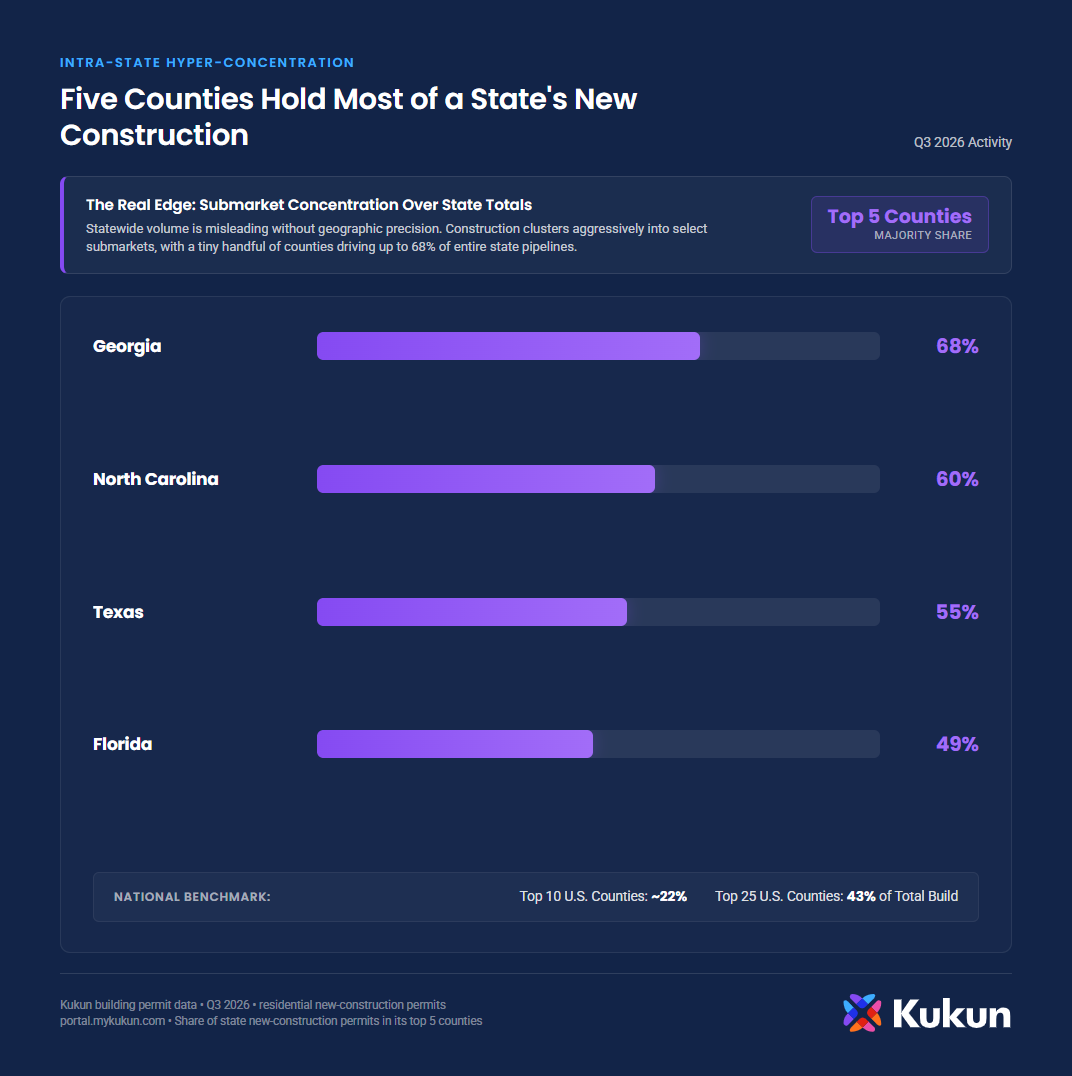
Nationally, the top 25 counties account for 43% of all residential new construction; the top 10 alone hold nearly 22%. And within a single state it’s tighter still: in Georgia, five counties make up 68% of the state’s new construction. In North Carolina, the top five are 60%. In Texas, 55%. In Florida, 49%.
For a construction lender, that is the whole game. You do not need to cover a state. You need the handful of counties where ground is actually breaking — and, inside them, the specific ZIP codes and subdivisions. The top counties in Q3:
- Maricopa, AZ — 5,060
- Spartanburg, SC — 4,878
- Tarrant, TX — 4,287
- Mecklenburg, NC — 4,132
- Hall, GA — 3,813
- Barrow, GA — 3,466
- Orange, FL — 3,289
- Gaston, NC — 3,222
- Horry, SC — 3,218
- Webb, TX — 3,212
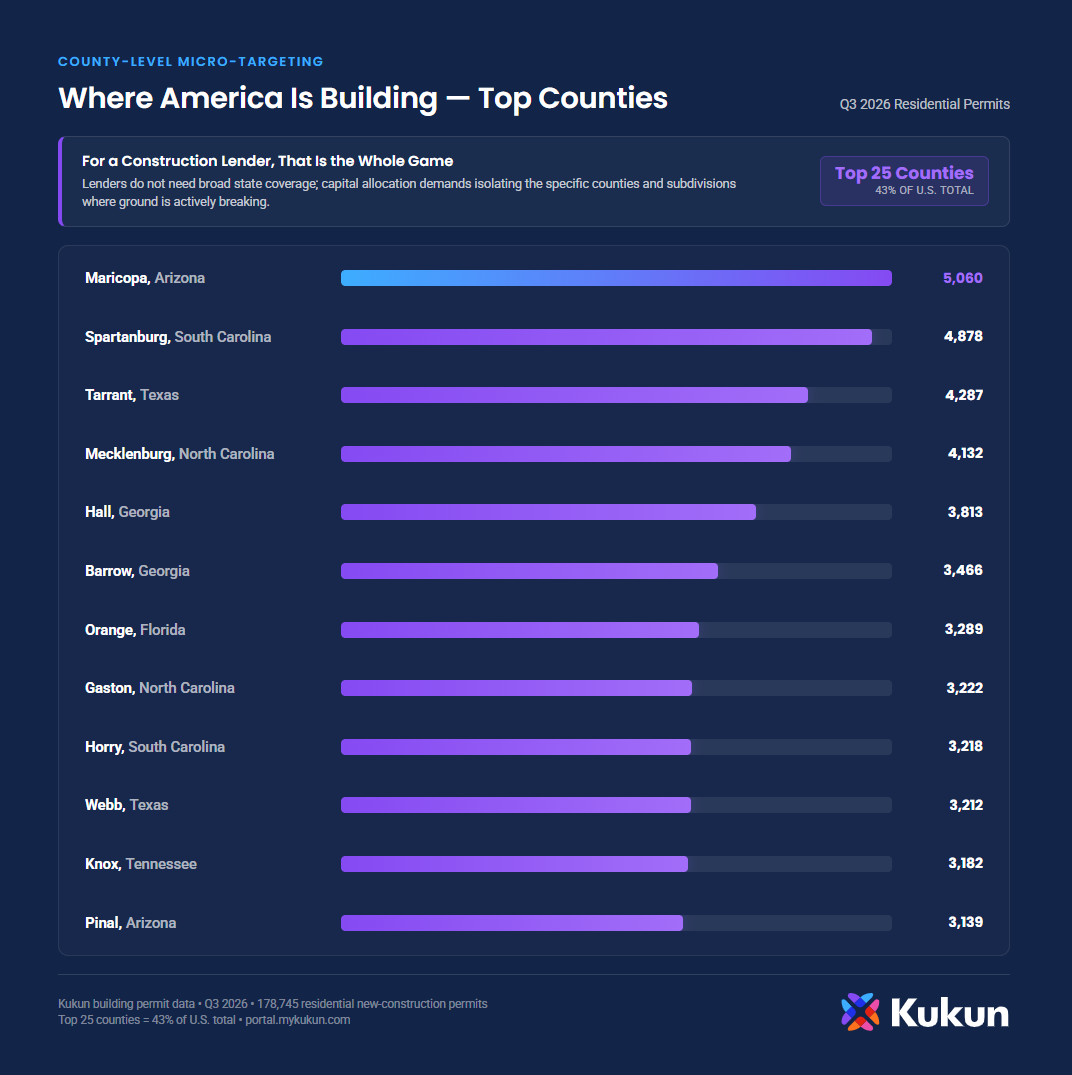
Spartanburg County alone filed nearly 4,900 new-construction permits in a single quarter. Each one is a project — and a potential borrower.
Why the permit is the earliest signal in construction lending
A ground-up permit is filed before the construction loan is locked. By the time a builder or owner is comparing financing, the project is already on the public record — address, lot, scope. The lender who waits for the loan application is meeting that borrower late. The permit names the project months earlier, and it names it at a specific address.
That’s the difference between prospecting a metro and knowing exactly where to show up. A county count tells you a market is hot. The permit tells you which lot.
What’s missing from the public number
Housing-starts data and county-level counts are everywhere — Census publishes them, builder associations publish them. What no one has is the actionable layer: every one of these permits as a specific project, tied to an address and the detail behind it (subdivision, square footage, unit type), matched to a lender’s geography and lending box. That’s the gap between a chart and a pipeline.
That’s what Kukun builds. The map above is the free version — where construction is forming. The part a construction lender can actually act on is the project list underneath it, down to the address, for the markets you lend in.
Want the full county breakdown, or your own market mapped? → get the Q3 New Construction Market Pack · or reply and tell us the market you lend in, and we’ll show you yours.

Methodology: Figures are residential new-construction permits in Kukun’s national building-permit database for Q3 2026 (July–September), classified by Kukun’s permit model and joined to property records. “Single-family” reflects permits explicitly tagged as single-family residences; building type is unspecified on a share of records, so single-family counts are conservative. Counts reflect permits in Kukun’s database, not a census of all U.S. permits, and coverage varies by jurisdiction. Figures describe permit volume and geographic concentration; unlike the Renovation-HELOC Index, new-construction permits are not equity-weighted, as newly built homes do not yet carry a valuation. About Kukun — the property knowledge graph for real estate AI, joining building permits, automated valuation (AVM), the PICO™ condition score, renovation cost and property records across 135M+ U.S. properties. Media / data inquiries: press@mykukun.com

Kukun Data Team
Home remodeling data at its finest. With expertise in all fields involved in your home, whether is real estate, construction, or remodel, our team of experts is here to walk you through the process.
Published November 2, 2026
Top business articles
Latest articles
Contact us

Join Property Signal
Kukun's monthly index on where home-equity demand is forming next. Built on national permit data.
Please enter a name
Please enter a valid e-mail